
Unlike the ABS birth data, the ABS death data is mapped according to date of occurrence not registration but the data is only mapped in the database when the death is registered. This means that the 11.6% of all cause deaths (coroner certified only deaths ) and approximately 2-3% of all other deaths, have yet to be entered into the provisional data for the period up to the end of July 2022.
The key data, published by the ABS is
- In 2022, there were 111,008 deaths that occurred by 31 July and were registered by 30 September, which is 16,375 (17.3%) more than the historical average.
- In July there were 17,936 deaths, 2,503 (16.2%) above the historical average.
- There were 300 (22.5%) fewer deaths due to COVID-19 in August than July (see article).
Conveniently, the ABS decides in calculating the historical average to leave out, the 2020 pandemic year, because ironically numbers of deaths were significantly lower than expected. They make no explanation for their reasoning, other than that it is significantly lower (which it actually isn't).
On the ABS website, 161,300 is the official number quoted as the final death count for 2020, and on the spreadsheet it is listed as 162,640; which are both higher than the years 2015, 2016 and 2018. Yes you are not seeing things; 2020 was not a historically low year for deaths.
To double down on this fact, I downloaded the deaths by months of occurrence and calculated the average yearly death total leaving 2020 out and not leaving it out. The average with 2020 included is 162,841.71 deaths and removing it, the average was 162,875.33 . These averages are almost identical and 2020 is certainly not a significant number of deaths lower than average.
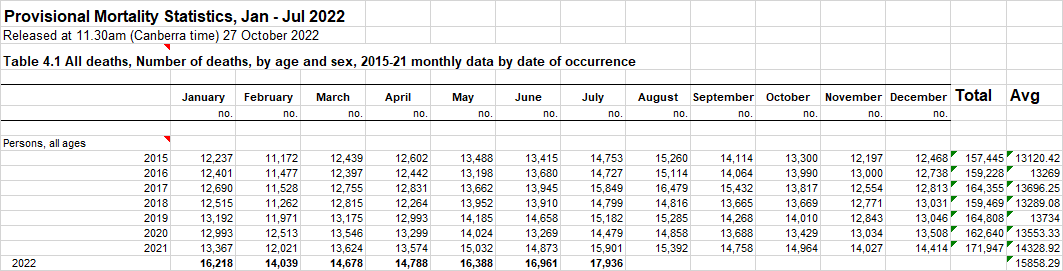
Looking at another page of the ABS website, it reports the that there were 171,469 deaths registered in 2021, an increase of 10,169 from 2020 (161,300). Now even if we were to take their latest release which has additional deaths added that are not the excel file, the 2020 year does not actually constitute a significant number of deaths less than average. If anything, 2021 should have been left out of calculating the baseline average because it is significantly higher.
I also uploaded a video talking about the astounding ABS death data, which is also mirrored on Rumble
https://youtu.be/DaWn8BLLoSg
https://rumble.com/v1wl5du-alarming-abs-death-data-analysis.html
CALCULATING THE STANDARD DEVIATION
Just to prove that point, I am going to do a standard deviation for this data set from 2015-2020, which gives me a standard deviation of 3031. The average for 2015-2020 is 161,324. We therefore expect that 95% of the data should fall between the mean plus/minus 2 standard deviations and 99.7% of the data will fall between the mean plus/minus 3 standard deviations under a normal distribution.
We therefore expect annual deaths to be between, 155,262 and 167, 386 for a 95% confidence interval. 152,231 and 170,417 for a 99.7% confidence interval. This means that the number of deaths in 2021 is statistically higher, in fact the excess death if you simply compare it to the average rate of deaths is up 6.58% in 2021!!
Whereas there is no significant decrease in deaths in 2020. The total number of deaths in 2020, regardless of what data set is used, whether it is the excel file that calculates 2020 death at 162,640 or the ABS website that states it is 161,300, fall well between the 95% confidence interval and is almost equal to the average number of deaths from 2015-2020, that is 161,324.
So why would the ABS continue to spout this misinformation that deaths in 2020, are significantly lower? The following line printed through out their website explains their rationale.
"All jurisdictions recorded an increase in death registrations in 2021. This follows lower death counts in 2020, after the introduction of public health measures to limit the spread of COVID-19."
"Deaths in 2020 were historically low"
If they can suggest that the number of deaths in 2020 was statistically lower, it justified the public health measures.
No matter how you want to spin it, there is no way you can conclude that deaths in 2020 were significantly lower. 2015, 2016 and 2018 were all lower. It's outrageous to make such a baseless claim.
If you wish to help support to my writing and work, go to subscribe (bottom right corner) or Donate and a special thanks to those who have gifted me, may the universe send you back abundance in return
REPEAT A LIE OFTEN ENOUGH
How many times have we heard it said, "the deaths were lower in 2020 because of the public health measures" but did anyone ever bother to check. Well no, because we think of the ABS as a trusted source of information.
Following the logic of the ABS to leave out outliners, the year 2021 should have been left out of the baseline average. The number of deaths in 2021, did not fall between the 99.7% confidence interval under a normal distribution. It was statistically higher. Incredible!!
The ABS however based on their flawed logic, decided that "The baseline includes deaths from 2015-19 (for 2021) and from 2017-19 and 2021 (for 2022)", which makes absolutely no sense what so ever! By including 2021 in the baseline average, the excess deaths for the first months of 2022, is actually higher than the reported 17%.
The baseline average should be from the years 2015 to 2020, which is 161,324 deaths.
If you take in the fact that so many people reportedly leaving Australia, the actual rate of death is being seriously under reported. Not to worry, so far in 2022, 3 million visas have been approved for people to come to Australia, which can be an way to fudge the data for future years. https://minister.homeaffairs.gov.au/AndrewGiles/Pages/3-million-visas-processed-backlog-down-to-755000.aspx
If you need an explanation on what standard deviation, averages/means, normal distribution is please have a read of the following.
 Jeanee Andrewartha
2022 DEATH DATA
For the following calculations I am using the baseline average as 161, 324
According to the ABS, in 2022, there were 111,008 deaths that occurred by 31 July 2022 and were registered by 30 September 2022. If we simply use a pro-rata approach, then for the following 5 months we expect there to be 79,291 deaths and a total of 190,300 expected deaths for 2022. This leaves the excess deaths over the average to be 17.96%.
If we use July 2022 as the monthly average to project the following 5 months, then the total deaths we expect would be 17,936 X 5 + 111,008 = 200,688 deaths
Calculating the excess deaths using this figure is 200,688/161,324 X 100= 124.4% . That is a staggering 24.4% increase in deaths!!! Equaling 39,363 people or 757 excess people dying each and every week.
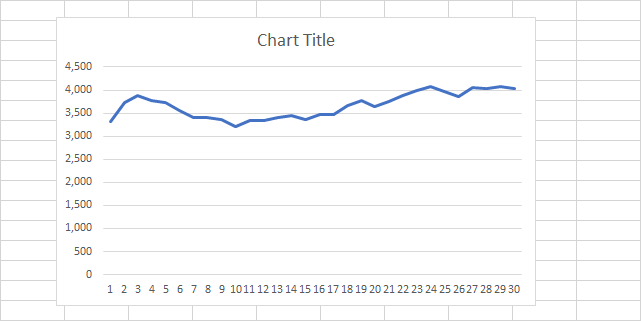
Below is the deaths plotted across time for 2022, as you can see the last 8 data points are stable, averaging out to 4,015 per week. equating to 17,398 monthly average, so using the July 2022 total to project excess death is more accurate than averaging the months of January 2022-July 2022, with the trend line clearly going up.
Even if we decide to compare 2022, to the statistically high number of deaths in 2021, this would be 200,688/171,469 = 1.17 or a 17% increase on a year that already had a 6.58% increase on the previous year. You can see why they added 2021 to the baseline average to lower the excess death rate because it reduces the excess death by approximately 1%.
Taking into account and the fact that we don't know the total proportion of deaths yet to be finalized for this period into the total; the fact that only that 11.6% of all cause - coroner certified only deaths have yet to be completed and 2-3% of all other deaths, we can confidently state that the excess death rate is in fact higher than 18%. https://www.abs.gov.au/statistics/health/causes-death/provisional-mortality-statistics/jan-jul-2022#timeliness-and-completeness-of-data
Is a 17-24.4% excess death rate for 2022, statistically significant. Absolutely, because even averaging out for the rest of 2022 based on the first 7 months of data, 190,300 falls way outside the 99.7% confidence interval and equates to 28,976 excess deaths or 557 excess deaths a week, almost 80 excess deaths a day.
These are truly HORRIFIC numbers.
Will the ABS in the future years calculation of averages, leave out the year 2022, which is significantly higher? In deciding what data to leave out of averages, the ABS is effectively drawing erroneous conclusions. So they could, compare 2023 data to 2022 data and find that there wasn't much of an increase even though both could be 17-24.4% higher than the statistical average in the years prior.
Not to worry, the ABS also have other methods to cover up the data. They use methods such as standardized death rate (SDR), which is comparing data to the Australian population at 30 June 2001. They also use the crude death rate, which uses an estimated population as of 30 June, which again they provide a number, with no rationale as to how the figure is calculated.
DEATHS BY AGE
Due to lack of data from the ABS website it is not possible to calculate a confidence interval or determine if a data point falls outside the normal ranges for the various age groups. The best we can do is to work out a percentage increase/decrease comparing it to the baseline average (as provided by the ABS).
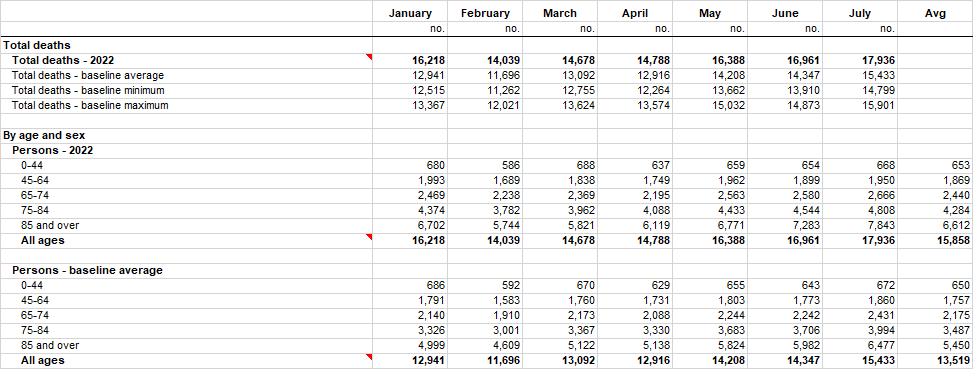
Using the table above the % increase is as follows.
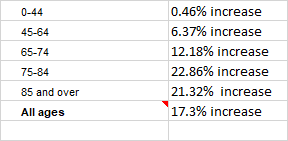
Based on other previous calculations, we could conclude that all age groups from 45 years and up had a significantly higher level of deaths, in particular the age groups 75 and older.
I do whatever happened to protecting the oldies, what we are seeing is staggering rates of deaths of older people.
It will be interesting to see when autopsies are finalized whether the death data by age 0-44 increases or not. The Sudden Unexpected deaths of people with no underlying health conditions are referred to the coroner for autopsy and there is apparently a backlog.
DEATHS BY CAUSE
Conditions on the medical certificate of cause of death are coded to the International Classifications of Diseases, 10th revision (ICD-10) (see Classifications section of the methodology for more information). ICD-10 codes are assigned to all conditions on a MCCD and rules applied to select an underlying cause of death. The World Health Organization (WHO) defines the underlying cause of death as the disease or injury that initiated the train of morbid events leading directly to death. Accidental and violent deaths are classified according to the external cause, that is, to the circumstances of the accident or violence which produced the fatal injury rather than to the nature of the injury. Data presented in this publication is tabulated according to the underlying cause of death.
Covid19 was given emergency use coding, which essentially led to anomalies such as were only two deaths from influenza in 2021, a record low. Who believes this could even be close to the truth? Although doctors were not meant to code deaths with covid19 as caused by covid19, due to the processes in place, that is exactly what happened, that deaths from other causes inadvertently ended up being coded as attributed to covid19.
Even the ABS website clearly states "died from or with";
"There are 12,545 death registrations that have been received by the ABS where an individual is certified as having died from or with COVID-19 between the start of the pandemic and 30 September 2022. Of the 443,774 death registrations received by the ABS (both doctor and coroner certified) in Australia during the pandemic period, 2.8% are of people who have died with or from COVID-19. This number of deaths is a preliminary figure and represents only those deaths for which registration has been completed through the jurisdictional Registries of Births, Deaths and Marriages (the civil registration system). The number of deaths of people who have died from or with COVID-19 during this time period will increase as additional registrations are received by the ABS. Deaths which occurred in the most recent published months (i.e. August and September) will have the largest increases as more registrations are received." Source: https://www.abs.gov.au/articles/covid-19-mortality-australia-deaths-registered-until-30-september-2022
As a consequence, analyzing death data based on cause is going to be problematic, when cause of death from other causes is put on the covid19 pile.
Key statistics from ABS website
- The mortality rate remained low in 2021 (507.2 per 100,000 people).
- Ischaemic heart disease was the leading cause of death.
- Suicide was the 15th leading cause of death.
- There were two deaths from Influenza, a record low.
- The rate for Alcohol-induced deaths was the highest in 10 years.
"Australia recorded significantly lower than expected mortality during the first year of the COVID-19 pandemic with death rates reaching historical lows." (This statement is outright misleading and an attempt to justify the draconian public health measures)
"As Australia entered the second year of the pandemic, COVID-19 continued to circulate with the Delta variant emerging and triggering public health response measures. The roll out of COVID-19 vaccines began in February 2021. These reports showed that the mortality rate remained low during 2021 with key causes certified by a doctor being cancers, ischaemic heart diseases and dementia. These provisional reports did not include information on the causes of coroner referred deaths due to the time required to complete coronial investigations."
2021 actually did record a 6.58% increase in deaths over baseline average. To suggest that the mortality rate remained low is outrageous. Perhaps they don't want to link it to the rollout?
One needs to bear in mind that due to border closures, for the period from February 2020 to the end of 2021, the population remained stable. Therefore the death data should have remained stable too.
2021: COVID-19 mortality according to the ABS
"Mortality data for 2021 largely covers deaths that occurred during the Delta wave of the pandemic, which began in Australia in mid-2021 and continued through to the end of the year.
- There were 1,122 deaths due to COVID-19 registered in 2021.
- 98.9% occurred during the Delta wave of the COVID-19 pandemic (July – December 2021). The ABS do not receive information on specific variants of COVID-19, and this information is based on date of death only.
- COVID-19 was the 34th leading cause of death.
- There were a further 31 people who died of other causes (e.g., cancer), with COVID-19 as a contributory cause of death.
When you look at the age break up of the people who died from covid19; the median age at death was 79.1 and New South Wales (557 deaths) and Victoria (553 deaths) had the highest number of deaths. Since the vaccine was rolled out in February 2021, this is a startling admission of it's failure. In 2020, the ABS recorded deaths from covid19 as 898 people. By their own numbers and words, not only did covid19 infections increase but so did the deaths.
CONCLUSION
After completing this article, I am actually quite shocked that conclusions can be made by the ABS that are not backed by data, parroted in media releases and then by every man and his dog, as truth. 2020 was not a historically low year for deaths but 2021 and 2022 were statistically high for excess deaths. From now on, unless I crunch the raw numbers for myself, I won't be blindly accepting anything the ABS says as truth.
The death data is alarming and even when the ABS are called out in parliament, on the anomolies in the birth data showing a huge drop in births in December 2021, the minister says that they apparently they track any significant changes and "if the ABS saw something in their data that would concern them, then..."
Well, obviously they will do nothing.
If a there are 757 excess deaths of people each week, rising from 204 excess deaths a week in 2021 and the ABS is not raising alarm bells, you do wonder how high the numbers have to go before it becomes a concern.
Jeanee AndrewarthaThis article only touched on how data is analysed. A whole other can of worms is opened when you look at how data is collected and coded.
I hold a degree in Statistics from Monash University and for this article, I did ask a University professor who taught quantitative and qualitative research methods to doctoral level students here in Australia and overseas for many years and published 7 edited books and many research papers, book chapters etc on doctoral research and supervision and have led PhD and other doctoral programs for many years before retiring about 11 years ago to read over the article too.
Subscribe to uncensoredwisdom.com for articles straight to your inbox.
If you wish to help support to my writing and work, go to subscribe (bottom right corner) or Donate and a special thanks to those who have gifted me, may the universe send you back abundance in return
For now, you can also find me on Linkedin at -
https://www.linkedin.com/in/jeanee-rose-andrewartha-42417b252
Youtube https://www.youtube.com/channel/UCFeyrnB2ZNUXgM2bLFwGI8A
Rumble https://rumble.com/user/Myheartsisters
Odysee https://odysee.com/@flossienightingale:5?view=content

