
Recently I came across data that appeared to show that in the month of December 2021, that there was a 72% decline in births and I went to the ABS website and downloaded the file myself and sure enough, the month of November 2021 and December 2021 showed significant declines.
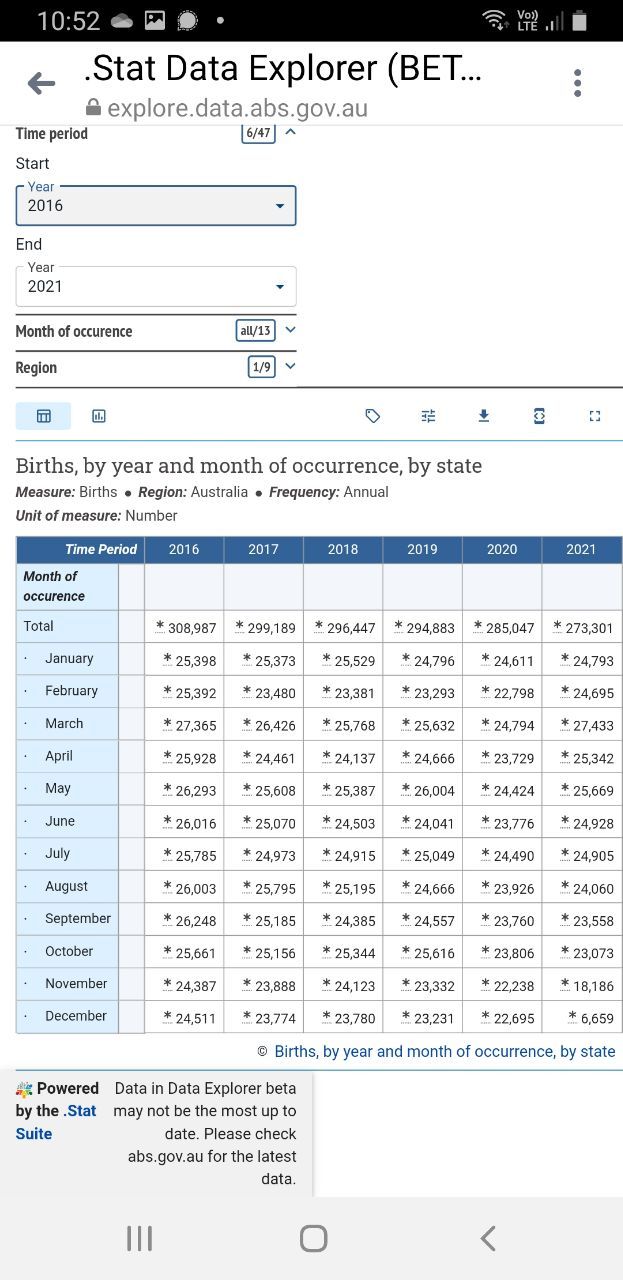
Taking a closer look, none of the total registered births on the above data set matched the data on other parts of the ABS website, which showed the opposite, that there was an increase in births in 2021.
Total Registered Births Australia
| 2016 | 311,104 |
|---|---|
| 2017 | 309,142 |
| 2018 | 315,147 |
| 2019 | 305,832 |
| 2020 | 294,369 |
| 2021 | 309,996 |
And looking even closer, the ABS counts registered births not actual births, so if a baby was born in 2014 but the birth was registered in 2021, then the baby is counted in the 2021 data not the 2014 data.
The following shows the distribution of birth registrations and a significant number from 2021 are from previous years and are also missing births from 2021 that haven't been recorded.
| State or territory of registration | 2014 and earlier (%) | 2015 (%) | 2016 (%) | 2017 (%) | 2018 (%) | 2019 (%) | 2020 (%) | 2021 (%) |
|---|---|---|---|---|---|---|---|---|
| New South Wales | 1.0 | 0.2 | 0.4 | 0.4 | 0.4 | 0.6 | 8.3 | 88.7 |
| Victoria | 0.5 | 0.1 | 0.2 | 0.2 | 0.3 | 0.8 | 12.0 | 85.9 |
| Queensland | 1.3 | 0.3 | 0.6 | 0.5 | 0.5 | 0.7 | 7.9 | 88.2 |
| South Australia | 1.3 | 0.1 | 0.2 | 0.4 | 0.4 | 0.5 | 7.2 | 90.0 |
| Western Australia | 1.3 | 0.1 | 0.2 | 0.3 | 0.4 | 0.6 | 8.9 | 88.2 |
| Tasmania | 1.2 | 0.1 | 0.2 | 0.4 | 0.1 | 0.2 | 1.9 | 95.8 |
| Northern Territory | 0.2 | _ | _ | _ | _ | _ | 6.5 | 93.2 |
| Australian Capital Territory | 0.3 | 0.1 | 0.1 | 0.4 | 0.2 | 0.5 | 7.5 | 90.8 |
| Australia | 0.9 | 0.2 | 0.4 | 0.4 | 0.4 | 0.6 | 9.0 | 88.2 |
This makes analyzing Australian birth statistics to be fraught with difficulties, and it's impossible to draw any definitive comparisons between short time frames like months or even year by year.
The data collection is also subject to non-sample error which includes:
- inaccuracies in collecting, recording and processing the data
- incompleteness of an individual record at a given point in time
- incompleteness of the dataset (e.g. impact of registration lags, processing lags and duplicate records and births that are never registered)
- lack of consistency in the application of questions or forms used by data providers, both through time and between different jurisdictions.
Every state also have differences in registration process. eg in Victoria the birth registration date is the date at which the record is completed in system, whereas New South Wales, Western Australia and the Australian Capital Territory, the birth registration date is the date at which the record is entered into the registration processing system.
In 2021, COVID-19 restrictions led to longer than usual delays in birth registrations in Victoria, which could explain why in the data set, Victoria only recorded 21 births for the month of December 2021.
On the Victorian government website it records the births as the following https://www.bdm.vic.gov.au/research-and-family-history/research-and-data-services/birth-statistics/births-registered-per-month
| December 2021 | 8,264 |
| November 2021 | 7,023 |
| October 2021 | 6,244 |
| September 2021 | 6,827 |
| August 2021 | 6,744 |
| July 2021 | 5,448 |
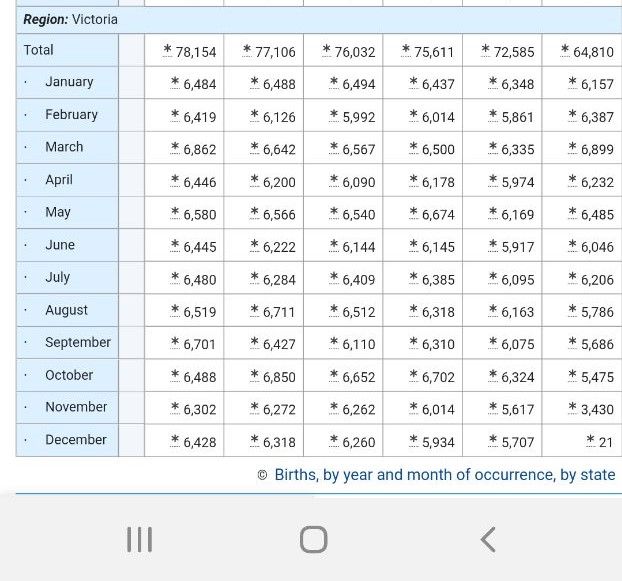
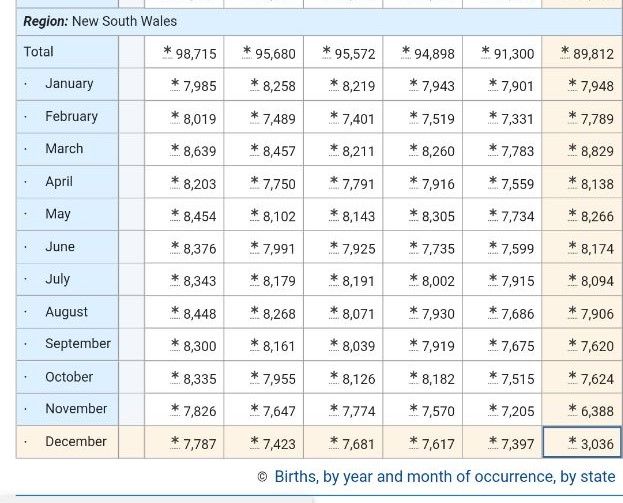
Yet on the ABS data from the "Births, by year and month of occurrence, by state of usual residence" data sheet, it records the totals as the table below (which includes a total of 21 registered births in December 2021) and it comes as no surprise that the numbers don't match up. Something is clearly wrong, and yet the ABS has not picked up on the error.
Bearing in mind that Victoria records births as registered on the day that a registration is completed in the system, a baby may be born in January and not registered in the system for months later. So it makes it meaningless to actually compare month by month, especially when there have been huge delays in processing.
The ABS data is only meant to draw long term projections but even then with Perinatal death report coming out 2-4 years later, if there was a problem with miscarriages and still births, the report would not be published for years after the fact by which time, whatever happened could potentially be smoothed over by analyzing data over years or using a higher population to calculate a lower overall rate.

When looking at the following data set
https://www.abs.gov.au/statistics/people/population/births-australia/latest-release?fbclid=IwAR0QgPS-sQDULqwxiX0w5iceNrex-FK8MeIiYaJwC-YUd5U58X6LhHaGgVw and then navigate to the link "Births, by year and month of occurrence, by state of usual residence
it's interesting to note that the month by month expected births is fairly stable, with little variation, all the way back to 1975. Then suddenly November 2021 and December 2021 are huge out liners. The question is, why hasn't anyone at the ABS picked up on the discrepancies in the data.
Calculating the births in 2021 in Victoria from the BDM website, the total is 76,823 births but is listed as 64, 810 and 76,414 on the ABS website. Surely someone is checking that the data actually matches up?
I did the following calculations based on the flawed idea that the data was accurate. I have decided to leave them in the article to show you, how statistical analysis can be done. Feel free to scroll all the way to the end for the conclusion of what I learnt from this exercise.
Just for fun, let's assume that the monthly birth data represents the actual births in that month and based off the data set on locality, I calculated the % reduction in December 2021 for Australia and the individual state and territories.
This table is a summary.
| Locality | Total births December 2021 | Percentage Births of Average | % reduction | Births out of 100 births |
| Australia | 6659 | 27.3% | 72.7% | 27 out of 100 |
| Victoria | 21 | 0.34% | 99.66% | 1 out of 300 |
| New South Wales | 3036 | 39% | 61% | 39 out of 100 |
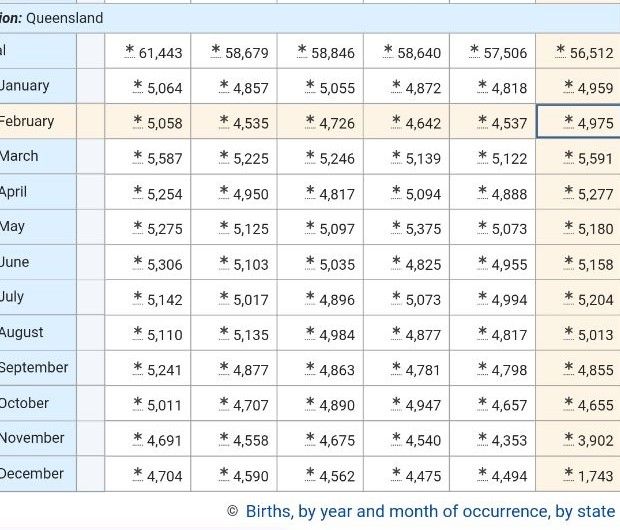
| Queensland | 1743 | 35.5% | 64.5% | 36 out of 100 |
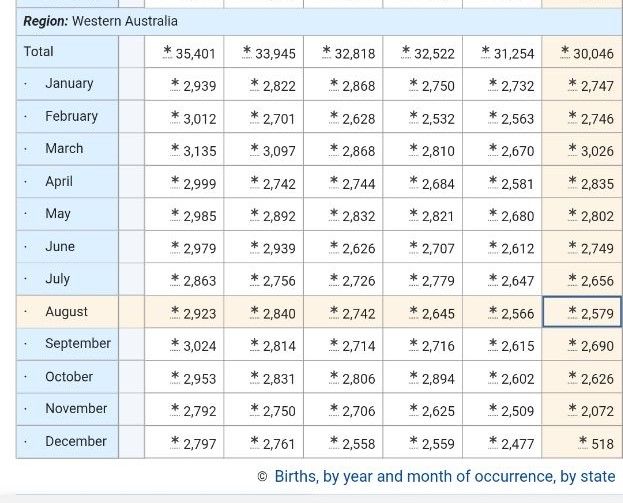
| Western Australia | 518 | 19.3% | 80.7% | 19 out of 100 |
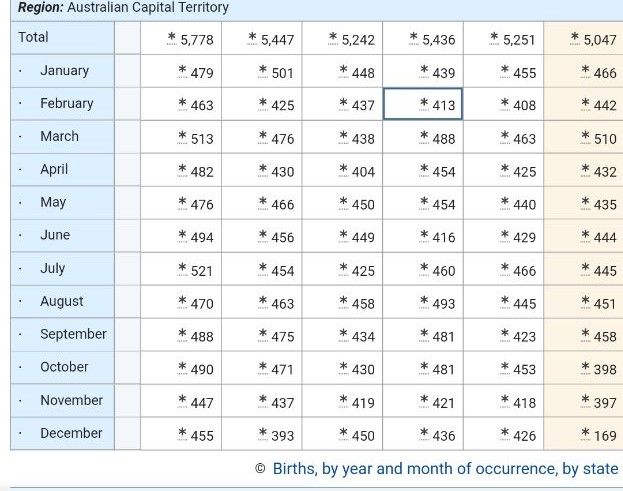
| Australian Capital Territory | 169 | 38% | 62% | 38 out of 100 |
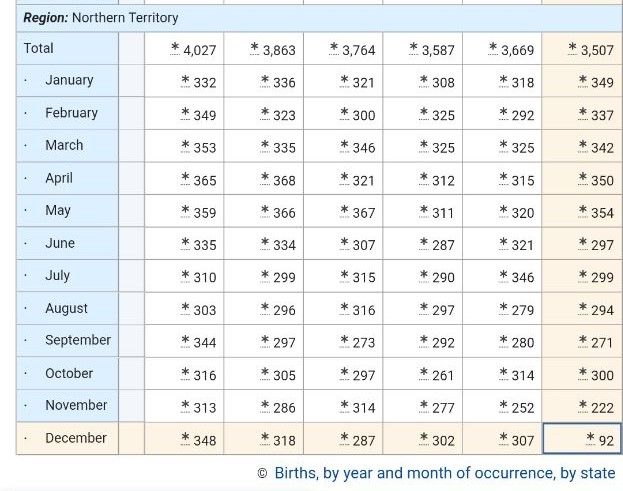
| Northern Territory | 307 | 30% | 70% | 30 out of 100 |
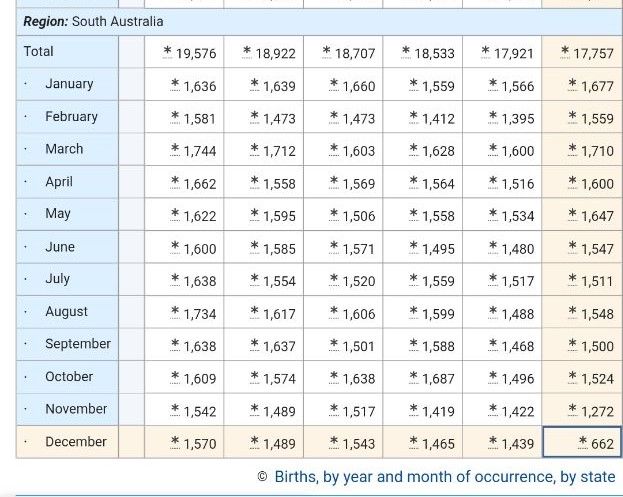
| South Australia | 1538 | 43% | 57% | 43 out of 100 |
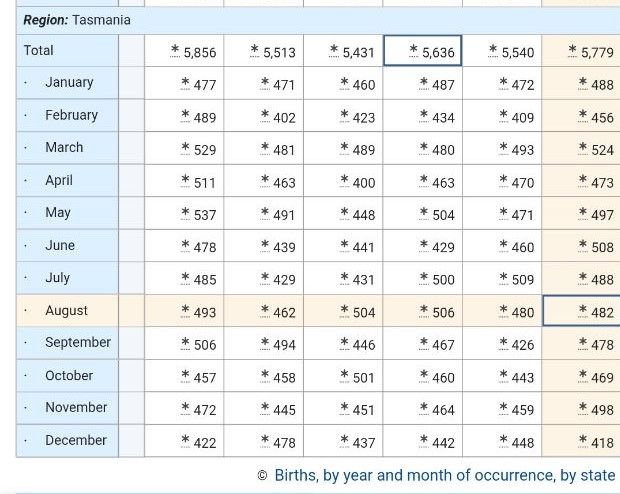
| Tasmania | 418 | 83.9% | lower but not significant | lower but not significant |
For the calculations I have used the 34 months of the pandemic from January 2019 to October 2021 as there was little in the way of population increase due to closed borders. Since November 2021 and December 2021 were clear outliners, I left them out in the calculation of mean (average) and standard deviation and then determined if these months were within the 99.7% confidence interval, calculating the average reduction in births based off the mean for the 34 month period.
Analyzing the data using more datasets going back to 2016, actually makes the decline in average births slightly worse. Generally though the data is consistent over time.

Australia recorded 18,186 registered births in November 2021 and 6,659 registered births in December 2021.
The average number of registered births for a month, from January 2019 to October 2021 was 24,364 births per month. This is the expected number of registered births across Australia for any given month. The standard deviation for births is 1064.184
(If I take the data back 70 weeks to January 2016, then the mean is 24,757 and the standard deviation is 1054, which actually makes the registered birth decline even worse 26.9%)
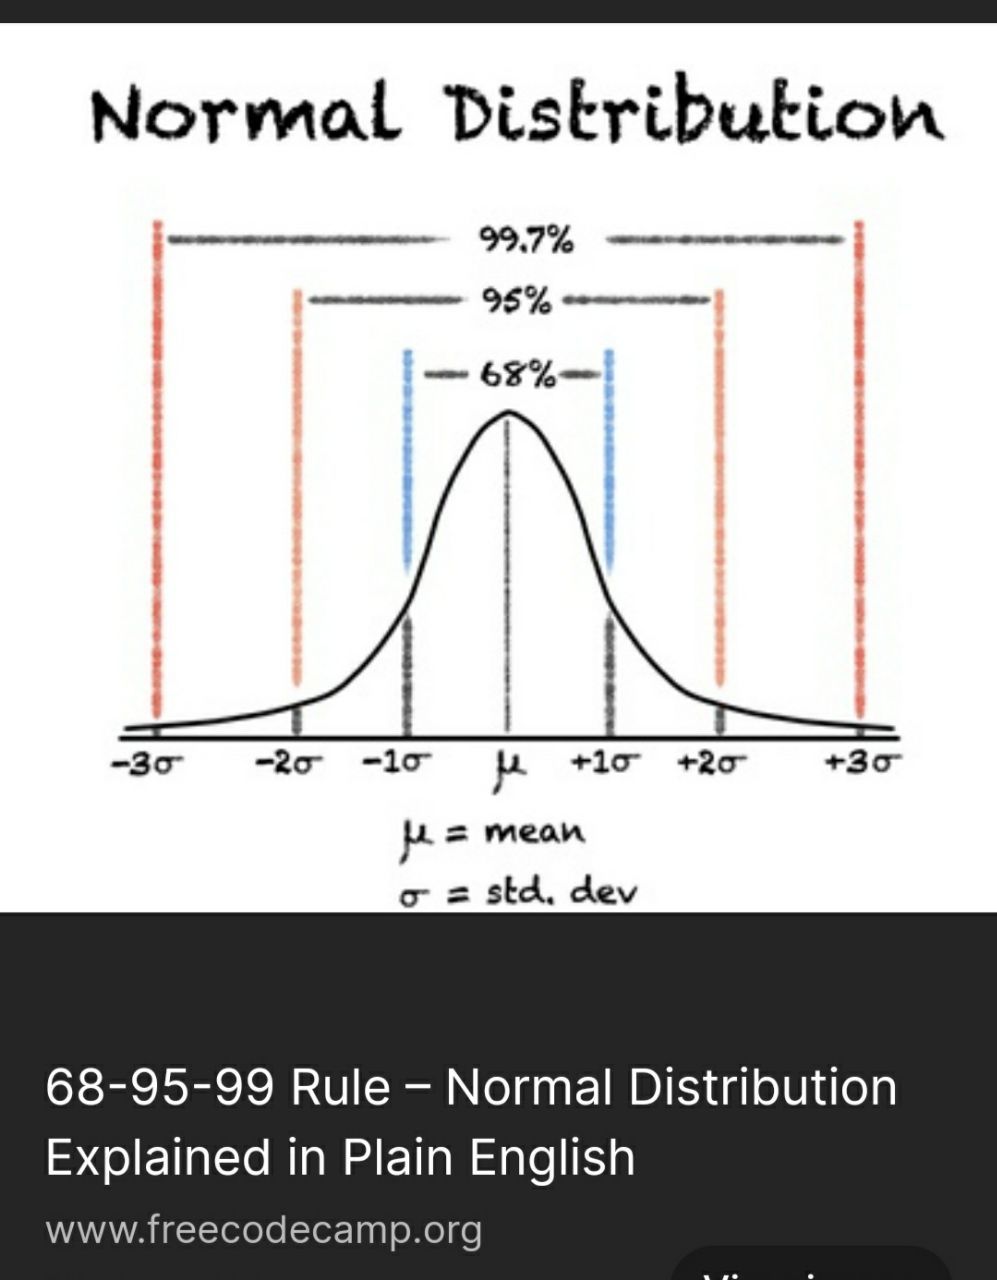
In mathematics, data following a normal distribution such as birth, you expect to see the following distribution (see below).
That 68% of the data should fall between the mean (average) plus or minus one standard deviation, 95% of the data should fall between the mean and 2 standard deviations and, 99.7% of the data should fall between the mean and 3 standard deviations.
So we expect that for this data set, 99.7% of the data should fall between 21, 171 and 27,556 births.
Both Nov 2021 and Dec 2021 fall far outside this range;at 18,186 and 6,659 births respectively
6659 births is so far off the charts it is outrageous and compared to the average it's only 27.33% of what it should be, which is 17, 705 less births for the month of December 2021 alone and over 16 standard deviations away from the average!!
Even on the low end of 3 Standard deviation it's 31.45% on the high end, 24.16%, 14,512 births and 20,898 respectively!! 6,659 is a ridiculously small number of births and if you look across the data all the way back to 1975, there is not a single month where births were even close to this number!!
Births by State
Victoria
Victoria is recorded in the data as registered 3430 births in November 2021 and only 21 registered births in December 2021.
The average registered births per month from January 2019 to October 2021 in Victoria is 6163. This is the number of registered births we would expect in any given month. The standard deviation is 315.61
(If I take the data back 70 weeks to January 2016, then the mean is 6298 and the standard deviation is 295, which actually makes the registered birth decline even worse )
So we expect that for this data set, 99.7% of the data should fall between 5216 and 7109 births. Both November 2021 and December 2021 fall way outside this range.
In November 2021, 55.7% or approximately half the average registered births and in December 2021 the number of registered births is 0.34% of the average. Registered births were down an astonishing 99.66% in December 2021!! This means that for every 300 babies that statistically would have been born, only 1 was born in Victoria.
This isn't even fathomable. There is something wrong with the data. There is no way only 21 births were recorded in Victoria in December 2021.
How is it though that over 10 months later, the data for December 2021 is so inaccurate?
New South Wales
New South Wales recorded 6,388 registered births in November 2021 and 3,036 registered births in December 2021. The standard deviation is 326.5
The average registered births per month from January 2019 to October 2021, is 7841. So we expect that for this data set, 99.7% of the data should fall between 6862 and 8820 births per month. Both November 2021 and December 2021 fall outside that range.
The December 2021 is 39% of the previous averages based on the mean of the 34 months from January 2019. Even if I average the months of December for the previous 5 years, the average is 7581 and the December 2021 is 40% of historical average.
A huge, unprecedented drop in registered births according to this data set.
Queensland
Queensland recorded 3,902 registered births in November 2021 and 1,743 registered births in December 2021.
The average monthly registered births from January 2019 to October 2021 in Queensland is 4912. This is the number of registered births we would expect in any given month. The standard deviation for this data set is 272.83
So we expect that for this data set, 99.7% of the data should fall between 4094 and 5730 births. Both Nov 2021 and December 2021 fall outside this range.
In December 2021, there was 35.5% of previous registered averages.
Another astonishing drop in number.
Tasmania
Tasmania recorded 498 registered births in November 2021 and 418 registered births in December 2021. A small drop but not significant.
The average registered births from January 2019 to October 2021 in Tasmania is 471. This is the number of births we would expect in any given month. The standard deviation for this data set is 26.4
So we expect that for this data set, 99.7% of the data should fall between 391 and 550 births.
The 498 and 418 births in November 2021 and December 2021 are not statistically significant because they fall in this range.
Western Australia
Western Australia recorded 2072 registered births in November 2021 and 518 registered births in December 2021, which is a significant drop.
The average monthly births from January 2019 to October 2021 in Western Australia is 2683 . This is the number of registered births we would expect in any given month. The standard deviation for this data set is 117
So we expect that for this data set, 99.7% of the data should fall between 2332 and 3034 births.
Both November 2021 and December 2021 fall outside these ranges.
In December 2021, there was 19.3% of previous registered averages.
Australian Capital Territory
Australian Capital Territory recorded 397 registered births in November 2021 and 169 births in December 2021, another large drop in births.
The average monthly births from January 2019 to October 2021 in ACT is 446 . This is the number of registered births we would expect in any given month. The standard deviation for this data set is 25.6
So we expect that for this data set, 99.7% of the data should fall between 369 and 523 births.
December 2021 falls outside this range.
Northern Territory
Northern Territory recorded 222 registered births in November 2021 and 92 registered births in December 2021.
The average registered births from January 2019 to October 2021 in NT is 307 . This is the number of births we would expect in any given month. The standard deviation for this data set is 25.6
So we expect that for this data set, 99.7% of the data should fall between 230 and 384 births.
Both November 2021 and December 2021 fall outside these ranges.
In December 2021, there was 30% of previous registered averages. Births were down an astonishing 70% !!
South Australia
South Australia recorded 1272 registered births in November 2021 and 662 registered births in December 2021.
The average registered births from January 2019 to October 2021 in SA is 1538. This is the number of births we would expect in any given month. The standard deviation for this data set is 89.7
So we expect that for this data set, 99.7% of the data should fall between 1269 and 1541 births.
December 2021 falls outside this range.
Registered births were down an astonishing 57% in December 2021.
CONCLUSION
To conclude, you really have to read the fine print on how the data is collected, recorded, analyzed in order to make sense of it. It's unbelievable that the ABS released this data set and no one looked at it and thought, wow..something is really wrong here, maybe we should go back and check the data. We are talking about data that is over 10 months old.
Analyzing the death data from the ABS is going to have the same issues as the birth data because the month the death is recorded in the ABS database generally will lag the actual month of death.
"When looking to measure change over time, the completeness of data for the most recent period is important. When data is received each month by the ABS, the lag between the date of death and the date of registration means that approximately 40-50% of reported registrations are of deaths that occurred in the month being reported. The remainder are deaths that occurred in earlier months."
Doctor certified and coroner referred deaths are not registered until the process has been completed, so we are not going to see these deaths in the data for many months, and I have heard that the coroner has not included the lower age groups of recent sudden deaths in the death data. It is speculated that the excess deaths for younger age groups are up 50%.
Although the ABS has reported a "In 2022, there were 111,008 deaths that occurred by 31 July and were registered by 30 September, which is 16,375 (17.3%) more than the historical average", the actual increase is potentially higher if there is a high number of autopsy or doctor certified deaths and as we are seeing with birth registrations, a lag in the time for registration, which means those births/deaths don't appear in the data set till much later.
In any respects, it is clear that the ABS is not designed as an early detection warning system of any potential problems but more a long term forecaster of trends because simply by it's design it is not set up to keep accurate month by month datasets, nor do the ABS analyze the data for statistical significance because if they did, they would likely find the 17% increase in all cause death to be a red flag.
The ABS is not a safety signal reporting system. Even outside of births and deaths, if the ABS reported falling rental vacancies, it would not follow that the government would do anything about the situation, such as reduce immigration or increase rental stock via various means at it's disposal. ABS simply publishes the data. Even if excess deaths hit 50%, it is their job simply to report it.
I left the calculations (above) to show how data is analyzed but you actually have to have accurate data in the first place in order to do the analysis and draw conclusions from it and since the ABS data can't even match the data published on the State government website, how reliable can it be?
I will be publishing an article, "how statistics are manipulated to lie to you" based on my time studying Statistics at Monash University where I graduated with High Distinction and studied under an excellent lecturer who taught us how statistics can be manipulated to basically say anything you want. He taught us how you could structure any research/study to draw conclusions that were untrue or illogical. He basically spent the whole semester lecturing us on how not to set up faulty studies and he would turn in his grave if he saw the level of incompetence and corruption today.
Interesting to note that Trevor Sutton, brother of the Chief Health Officer Brett Sutton who was responsible for the pandemic response in Victoria, now chairs the Governing Council of the Statistical Institution for the Asian and Pacific Region. His previous roles in the ABS include the Chief Operating Officer and the Deputy Australian Statistician heading the Social Statistics Group. Department of Finance secretary Jane Halton who attended the Event 201, pandemic response in October 2019, is the wife of deputy Australian statistician Trevor Sutton, according to the news article below.
Traditionally the ABS is meant to be independent but in the real world, with real people and real agendas, that may be naive to presume. Most people will generally read the summary statements from the ABS, and will not get into the nitty gritty.

For this article, I did ask a University professor who taught quantitative and qualitative research methods to doctoral level students here in Australia and overseas for many years and published 7 edited books and many research papers, book chapters etc on doctoral research and supervision and have led PhD and other doctoral programs for many years before retiring about 11 years ago, to check my calculations.
Unfortunately, we can't draw any conclusions from this data, other than there are some real issues at the Australian Bureau of Statistics, apart from them being months late on reporting. Maybe they are having staff shortage problems too.
Subscribe to uncensoredwisdom.com for articles straight to your inbox.
For now, you can also find me on Linkedin at -
https://www.linkedin.com/in/jeanee-rose-andrewartha-42417b252

